Python has been the seductive programming language for data scientists for some time. When looking for resources, courses, or training in the field of Data Science, you will find that knowledge of Python is essential.
Anyone who works in Data Science is certainly familiar with Python libraries. The number of these libraries is huge, which is why it is not always easy to name them and cite their functionality.
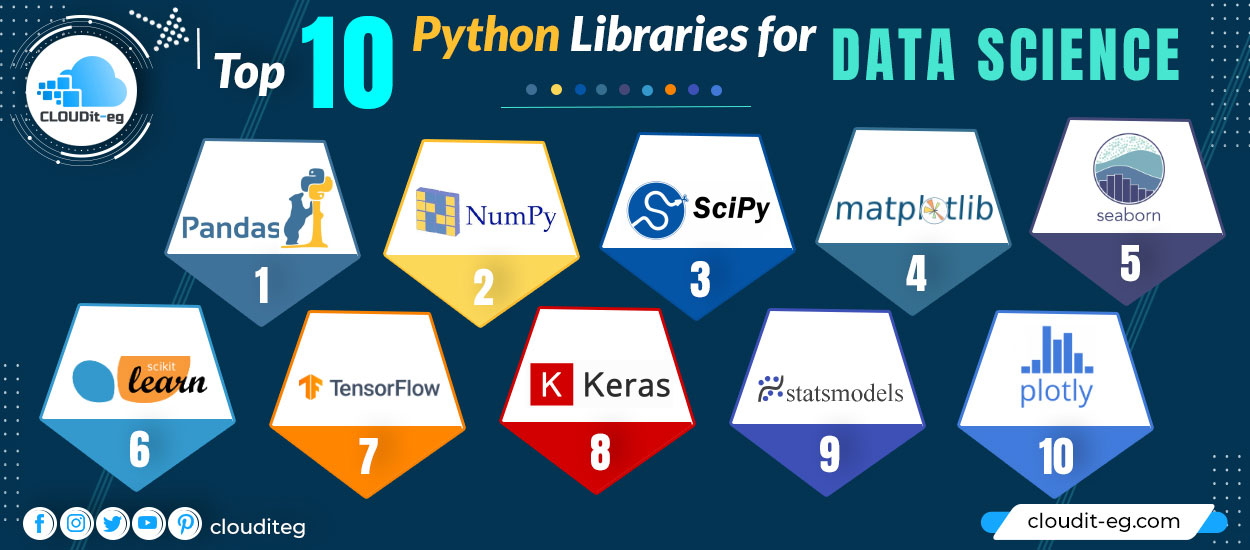
In this article, we’ll see the top 10 Python libraries used in Data Science and list their pros and cons.
1. Pandas
Pandas is an open-source Python package that
[affegg id=1]
provides high-performance, easy-to-use data structures, and data analysis tools for labeled data in the Python language. It stands for Python Data Analysis Library.

When to use
Pandas is designed for fast and easy data manipulation: Reading, aggregation, and visualization.
Pandas take input data from a CSV or TSV file or from an SQL database. Then, It creates a Python object with rows and columns called a data frame. Note that the database is very similar to a table in statistical software, such as Excel.
What can we do with Pandas?
- Indexing, manipulation, renaming, sorting, merging of data frames
- Update, add, delete columns from a database
- Detection of missing files and management of missing data
- Graphical representation of data
- The above makes Pandas a basic library in learning Python for data science.
2. NumPy
It is one of the most basic packages in Python. Numpy is a general-purpose array processing package. It provides high-performance multidimensional array objects and tools for working with these arrays. Numpy is an efficient container of generic multidimensional data.
The main object of Numpy is the multidimensional homogeneous array. It is a table of items or numbers of the same data type, indexed by a set of positive integers. In Numpy, dimensions are called axes and the number of axes is called a rank.
When to use
Numpy is used to process arrays that store values of the same data type. It facilitates mathematical operations on arrays and their vectorization. This dramatically improves performance and speeds up execution time.
What can be done with NumPy?
- Basic array operations: add, multiply, cut, sort, index
- Advanced table operations: stack tables split into sections, broadcast networks
- Working with linear algebra
- Basic slicing and advanced indexing in Numpy Python
3. SciPy
The Scipy library is one of the core packages that make up the Scipy stack. There is a difference between Scipy Stack and the Scipy library. Scipy relies on the Numpy object and is part of the stack which includes tools like Matplotlib, Pandas, and Sympy with additional tools.
The Scipy library contains modules for efficient mathematical “routines” such as linear algebra, interpolation, optimization, integration, and statistics. The main functionality of the Scipy library is built on Numpy and its tables.

When to use
Scipy uses arrays as the basic data structure. It has various modules to perform common scientific programming tasks such as linear algebra, integration, calculus, ordinary differential equations, and signal processing. When to use it? Scipy uses arrays as the basic data structure. It has various modules to perform common scientific programming tasks such as linear algebra, integration, calculus, ordinary differential equations, and signal processing.
4. Matplotlib
this is another library in the Scipy stack. Matplotlib draws 2D figures.
When to use
Matplotlib is the plotting library for Python that provides an object-oriented API for integrating plots into applications. It looks a lot like MATLAB.
What can be done with Matplotlib?
Thanks to Matplotlib, we can plot Histograms, bar graphs, scatter diagrams, area graphs to pie charts. Matplotlib can represent the data in several visualizations:
- Line charts
- Scatter charts
- Surface graphics
- Bar charts and histograms
- Pie charts
- Stem plots
- Contour plots
- Quiver plots
- Spectrograms
5. Seaborn
when you read the official documentation on Seaborn, it is defined as the Matplotlib based data visualization library which provides a high-level interface to draw attractive and informative statistical graphs. To put it simply, seaborn is an extension of Matplotlib with advanced features.

What is the difference between Matplotlib and Seaborn?
Matplotlib is used for basic plotting; bars, pies, lines, scatter plots, and more while, Seaborn provides a variety of visualization models that are less complex and with less syntax.
What can be done with Seaborn?
- Find the link between several variables (correlation)
- Underline categorical variables for aggregate statistics
- Analyze univariate or bivariate distributions and compare them to different subsets of data
- Plot linear regression models for dependent variables
- Provide high-level abstractions, multi-batch grids
- Seaborn represents the second hand of R visualization libraries like corrplot and ggplot.
6. Scikit Learn
Scikit Learn is a robust machine learning library for Python. It has ML algorithms like Svms, random forests, k-means clustering, spectral clustering, mean shift, cross-validation… etc. Scikit Learn part of the Scipy stack.

When to use
Scikit-learn provides a range of supervised and unsupervised learning algorithms through a consistent Python interface.
What can be done with Scikit Learn?
- Classification: Spam detection, image recognition
- Grouping
- Regression: customer segmentation, a grouping of experience results
- Dimensional reduction: Visualization, Increased efficiency
- Model choice: Improved accuracy through parameter adjustment
- Pre-processing: Prepare input data as a text for processing with machine learning algorithms.
- Scikit Learn focuses on data modeling, not data manipulation. We have Numpy and Pandas for handling.
7. TensorFlow
Tensorflow is an artificial intelligence library that helps developers create large-scale neural networks with many layers using data flow graphs. Tensorflow also makes it easy to build deep learning models, pushes the state of the art in ML / AI, and enables easy deployment of ML-powered applications.
Giants like Google, Coca-Cola, Airbnb, Twitter, Intel, Deepmind, use Tensorflow! Which proves its usefulness and robustness.
When to use
Tensorflow is very effective when it comes to classifying, perceiving, understanding, discovering, predicting, and creating data.
What can be done with TensorFlow?
- Voice and sound recognition
- sentiment analysis
- Text apps – Threat detection, Google Translate, Gmail smart response
- Facial recognition – Facebook Deep Face, Photo tagging, Smart Unlock
- Time Series – Recommended by Amazon, Google, and Netflix
- Video detection – Motion detection, real-time threat detection in games, security, and airports
8. Keras
Keras is Tensorflow’s high-level API for the development and training of Deep Neural Network code. It is an open-source neural network library in Python. With Keras, statistical modeling, working with images and text is much easier, especially with the simplified coding for deep learning.

What’s the difference between Keras and Tensorflow after all?
Keras is a Python neural network library while Tensorflow is an open-source library for various machine learning tasks. Tensorflow provides both high-level APIs and low-level APIs while KERA provides only high-level APIs. Keras is built for Python which makes it much more user-friendly, modular, and composable than Tensorflow.
What can we do with Keras?
- Determine the percentage of accuracy
- Define the loss function
- Create custom function layers
- Integrated data and image processing
- Write functions with repeating code blocks: 20, 50, 100 layers deep
9. Statsmodels
Statsmodels is the ultimate Python package that provides easy calculations for descriptive statistics and estimation for statistical models.

What can be done with Statsmodels?
- linear regression
- Correlation
- Ordinary Least Squares (OLS) for the economist in you!
- Survival analysis
- Generalized linear models and Bayesian model
- One-dimensional and two-dimensional analysis, Hypothesis testing (basically, what R can do!)
10. Plotly
Plotly is a graph library for Python. Users can import, copy, paste or distribute data that needs to be analyzed and visualized. Plotly offers a sandbox Python (Something where you can run a Python that’s limited in what it can do) Now I’ve had a hard time figuring out what sandboxing is, but I know for a fact that Plotly makes it easy!
When to use
You can use Plotly if you want to create and display numbers, update numbers, hover over text for details. Plotly also has the additional function of sending data to cloud servers. It’s interesting!
What can you do with Plotly?
The Plotly Charts Library has a wide range of charts you can plot:
- Basic Charts: Line, Pie, Scatter, Bubble, Point, Gantt, Sunburst, Treemap, Sankey, Filled Area Charts
- Scientific graphics: Contour, Ternary, Log, Quiver, Carpet, Radar, Windrose heat maps and Polar Plots
- Financial data
- Maps
- Subplots
- Transforms
- Jupyter Widgets Interaction
Plotly is the parcel library par excellence. Think about visualization and plotly can do it!
